 Facebook
 Twitter
 Pinterest
 Copy Link

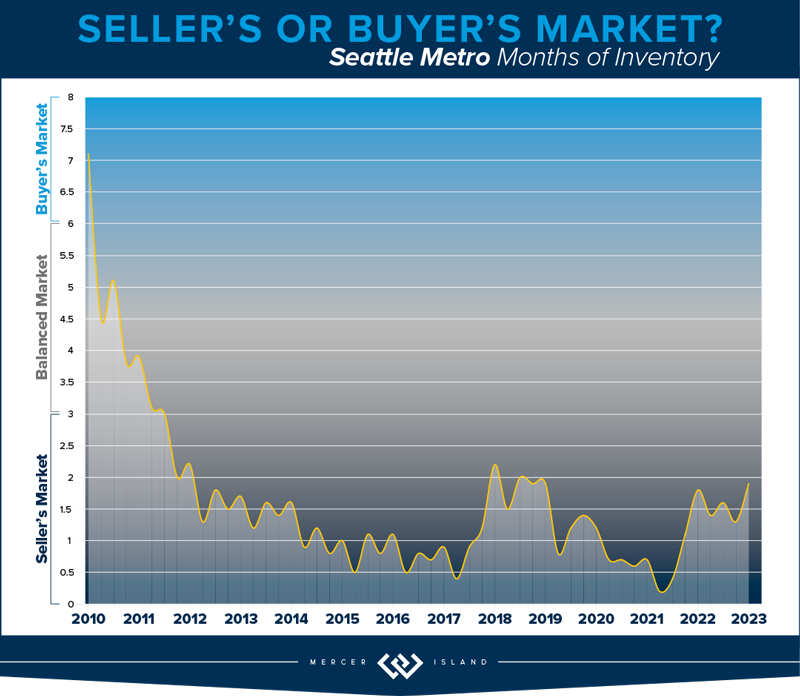
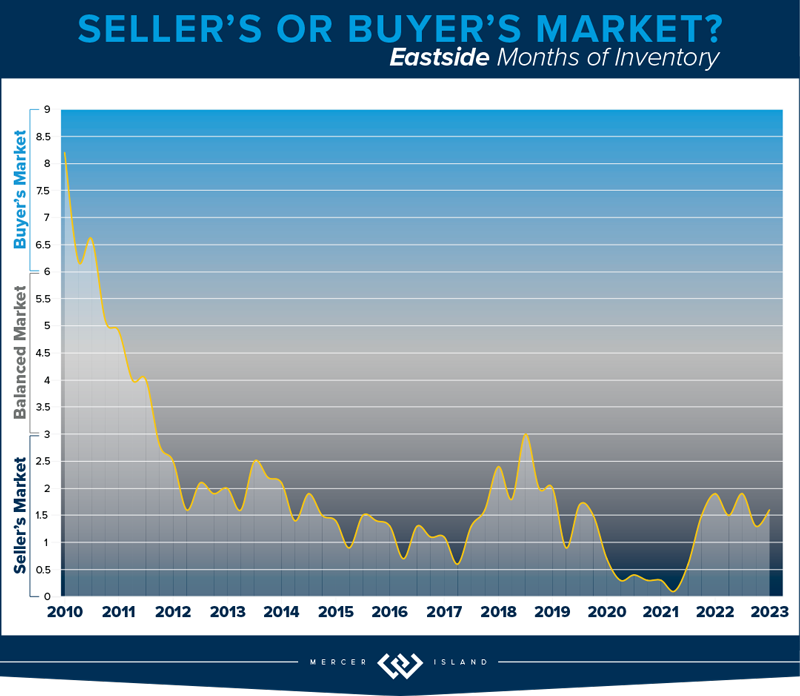
While median sales prices varied quite a bit from area to area, they stayed relatively stable with most communities posting either modest gains or slight declines compared to this time last year. Low inventory is keeping us in what you might call a “flat” seller’s market…supply is low but prices aren’t appreciating as fast as we would normally see. That being said, if rates float down—and experts believe they will—we could see another frenzy of bidding wars as buyers compete for the few homes on the market. If you’re considering purchasing a home (even if you need to sell yours first), our advice is to get out there and start shopping while you can pick and choose at relatively reasonable prices…
Click or scroll down to find your area report:
Seattle | Eastside | Mercer Island | Condos | Waterfront
SEATTLE
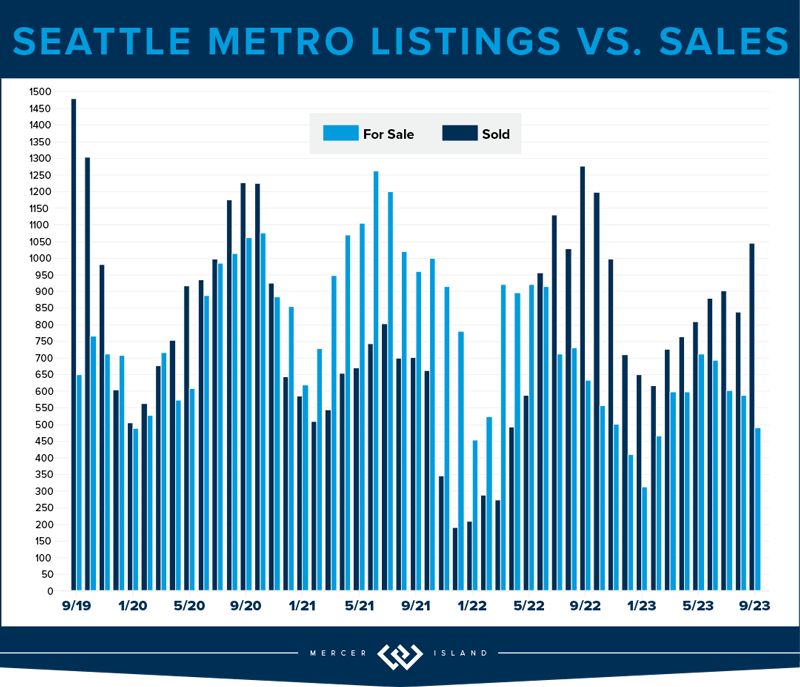
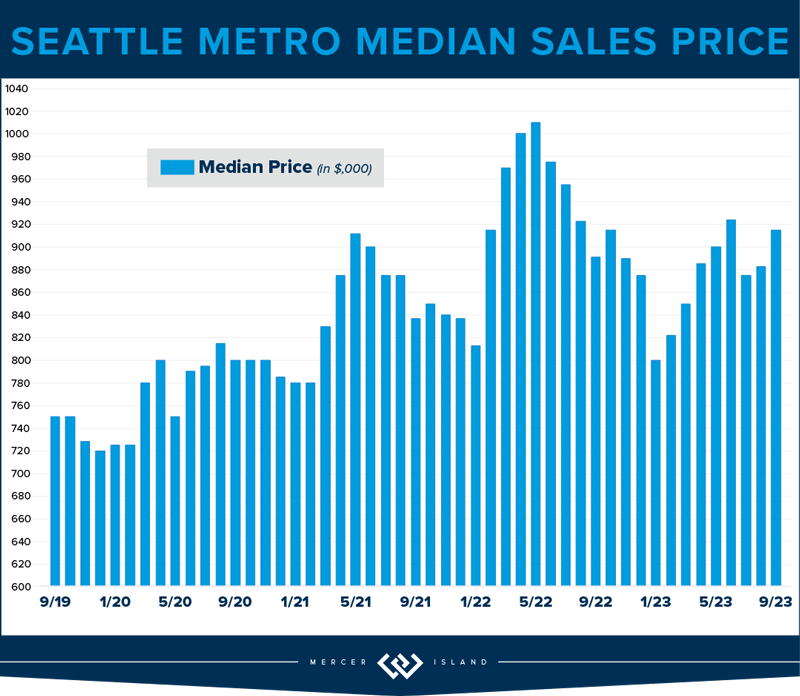
The Seattle residential market showed resilience in Q3 of 2023. While the $894,000 median sales price was down 3% from last year, 60% of sellers fetched sales at or above their list price and 58% sold within the first 10 days. The city saw 2,321 new listings, a 23% reduction from the previous year. This is healthy, for now, with decreased demand due to rising interest rates. When rate pricing eases—and it will according to experts—the lower inventory will be sure to send prices through the roof. NOW IS THE TIME!
Diving deeper into communities, Queen Anne, with its blend of historic charm and modernity, saw a 1% rise in median sales prices to $1,349,000. Kenmore and Lake Forest Park have also held their own—60% of homes sold within the first ten days and both median sales prices and cost-per-square-foot went up 2% over last year. North Seattle remains a strong contender in the market, with 68% of homes selling at or above the list price. West Seattle, with its coastal vibe, saw a remarkable 72% of homes sell at or above the listing price.
The data underscores Seattle’s diverse and dynamic housing landscape, where different communities cater to varied tastes, yet all show promise and potential. Overall, Seattle’s housing market is marching on, optimistically steady, backed by strong analytical data and historically low unemployment.
Click here for the full report and neighborhood-by-neighborhood statistics!

EASTSIDE
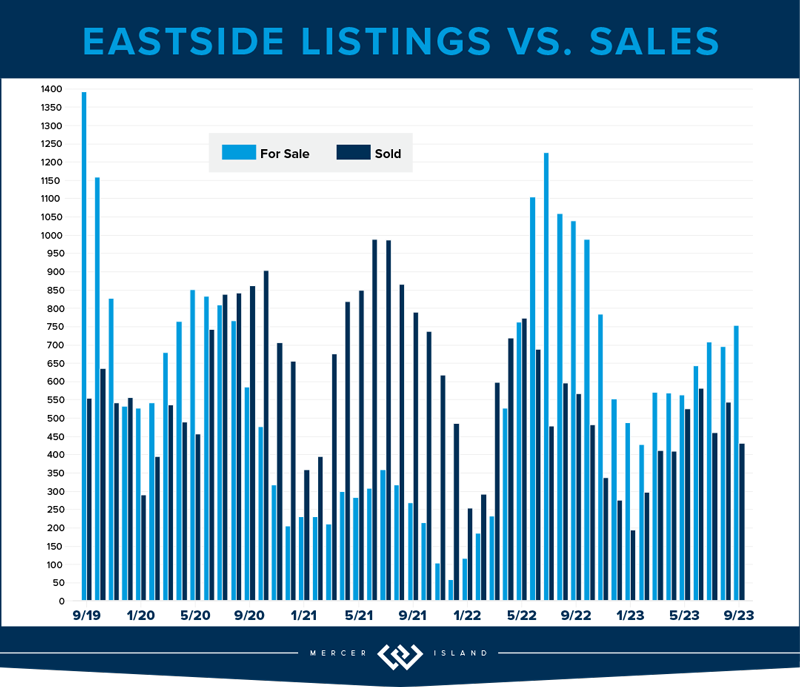
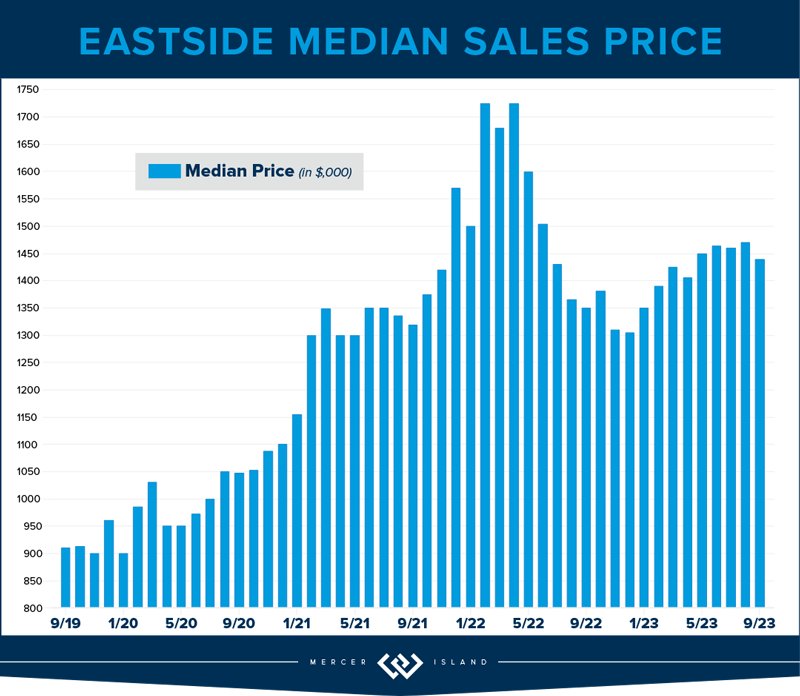
The Eastside showed steady growth in Q3. With a notable 5% year-over-year rise in home values, the median sales price landed at a respectable $1,460,000. Interestingly, cost per square foot ($625) showed virtually no YOY change. Sellers saw a close alignment with their expectations, as the average list price to sale price for all properties stood at 99%. Furthermore, 58% of homes sold at or above their listing price, a testament to the region’s enduring demand.
Diving deeper, most communities remained fairly stable with modest year-over-year increases. Redmond, Mercer Island and Newcastle/North Renton saw slight declines. The star of the Eastside was West Bellevue, posting 23% more sales than Q3 of last year, a median sales price hike of 14%, and the highest cost-per-square-foot in the region (even after a 14% drop from last year). While overall sales were down about 13% across the region, this was counterbalanced by a 20% drop in new listings keeping the Eastside in a flat seller’s market for the foreseeable future.
Our conclusion? The Eastside’s market remains robust and versatile. Buyers and sellers both need to be savvy, understanding both their micro-markets and the broader trends. For sellers, strategic pricing and presentation remain king! Our advice to buyers: don’t sleep on this market, it will turn fast when interest rates float downward and inventory will not be able to keep up with demand.
Click here for the full report and neighborhood-by-neighborhood statistics!

MERCER ISLAND
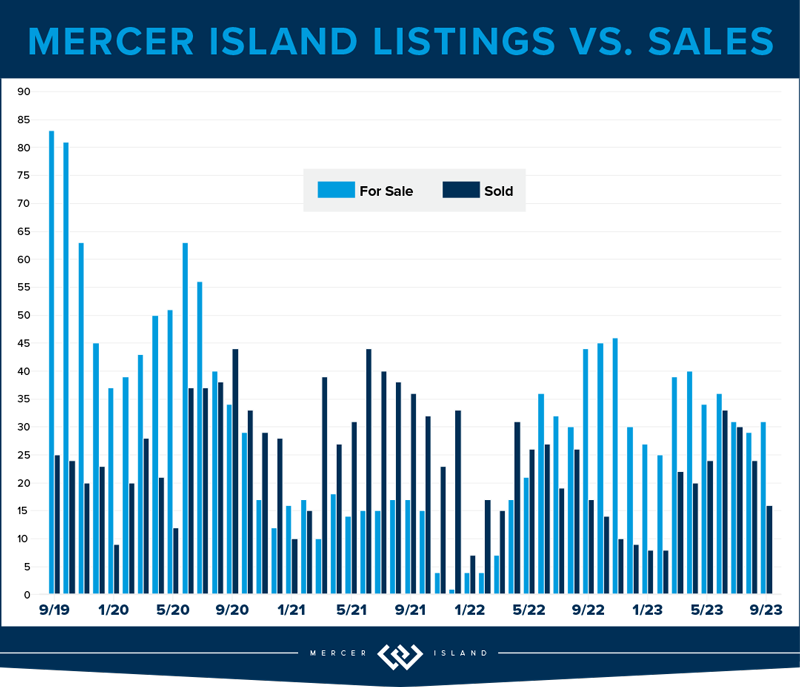
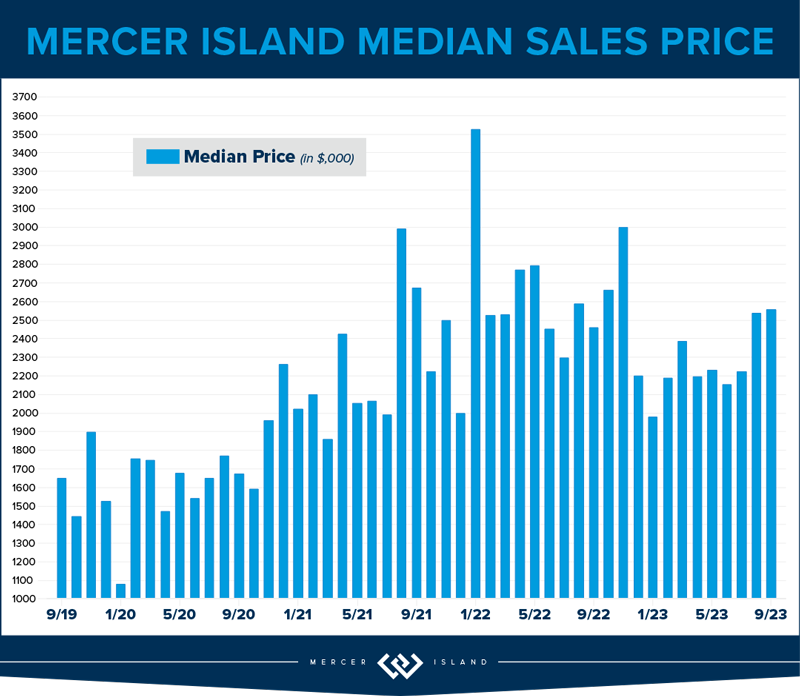
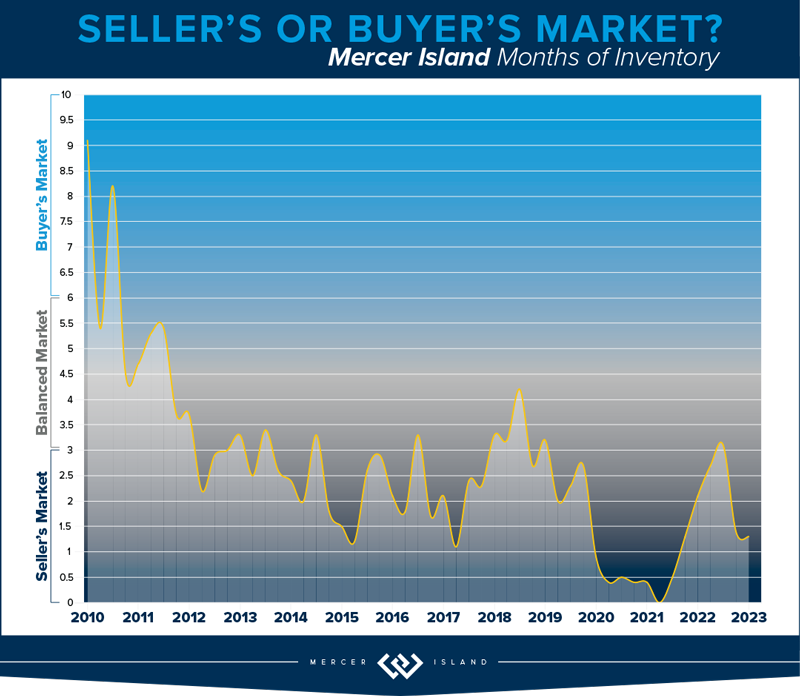
While Mercer Island’s Q3 median sales price of $2,368,000 was still down slightly compared to Q3 of last year, prices have been trending upward since the beginning of the year. Furthermore, the average price-per-square-foot in Q3 was actually up 6% over last year. More than half of homes sold at or above their list prices (53%) and in 10 days or less (57%)—this is right on par with what we saw in Q3 of 2022. Buyers found room to negotiate on the remaining listings and were able to add contingencies for things like inspections and financing.
We saw a boost in sales compared to last year’s initial interest rate shock, despite a lower number of new listings. This has kept the Island in a flat seller’s market much like we saw in 2018. That being said, Mercer Island homes are taking longer to sell than we saw last year—the average total number of days properties spent on the market before receiving an offer went from 18 days in Q3 2022 to 30 days by Q3 2023. Buyers, perhaps more hesitant due to higher interest rates, are being careful to pick and choose before leaping into a contract.
Overall, the Mercer Island real estate market has remained fairly steady with some signs of growth. While median prices are still down from their spike during the post-COVID frenzy, we should start seeing year-over-year gains if this year’s upward trend continues. For prospective buyers, the landscape offers an opportunity to negotiate favorable deals on those properties that don’t sell right away. For sellers, astute pricing and marketing strategies will continue to win the day.
Click here for the full report and neighborhood-by-neighborhood statistics!

CONDOS – SEATTLE & EASTSIDE
The PNW condo market showed steady growth in Q3 of 2023, with year-over-year median sales prices up by 6% in both Seattle and The Eastside. Overall activity was subdued, however, with a drop in the number of new condo listings corresponding with fewer sales.
When dissecting Seattle’s condo statistics, Shoreline, Lake Forest Park and Kenmore saw the biggest price gains with a whopping 39% rise in median sales price compared to last year. Ballard and Green Lake also saw big gains with median sales price up 25%. Conversely, Shoreline experienced a stark 59% drop in sales and 40% drop in median sales prices, indicating possible shifts in buyer preferences toward the more convenient city center. While Downtown condo sales prices were also down slightly, their shimmering skylines still fetched a premium at $825 per square foot.
The Eastside condo market varied from area to area. Kirkland’s condo sales surged by 18%, with an impressive 43% increase in median sale price. Redmond also shone brightly with a 45% spike in median sale prices. Mercer Island stood out, with its 43% increase in the number of sales and 31% rise in median sale price showcasing its luxury market segment. Conversely, West Bellevue, East Bellevue, and East Lake Sammamish all posted lower year-over-year median sales prices—down -20%, -%12% and -7% respectively.
The juxtaposition of these two markets, and really the neighborhood specific swings within them, highlights the unique characteristics and demands of each, underscoring the need for prospective buyers and sellers to strategize based on specific community data. All the more reason to consult a condo pro!
Check out area-by-area details the full condo report.

WATERFRONT
Seattle once again commanded the highest number of private waterfront sales with 9 total—4 of these sold in 4 days or less, including 2 hot Beach Drive listings in West Seattle that sold above their asking prices. Lake Sammamish was close behind with 8 sales including one that sold immediately (and marked the most affordable waterfront sale at $1.62 million). Mercer Island boasted the highest waterfront sale of the quarter, a stunning North End estate on 120 feet of waterfront that went for $24.4 million. The Eastside held its own with 6 sales and the second highest sale of the quarter—$12 million—for a half-acre Yarrow Point estate on 105 feet of prime west-facing waterfront.
This brief overview of the entire Seattle-Eastside private waterfront market, including Mercer Island and Lake Sammamish, illustrates the trends occurring in our region over time. This data is interesting and insightful but cannot replace an in-depth waterfront analysis with your trusted professional.

We earn the trust and loyalty of our brokers and clients by doing real estate exceptionally well. The leader in our market, we deliver client-focused service in an authentic, collaborative, and transparent manner and with the unmatched knowledge and expertise that comes from decades of experience.
© Copyright 2023, Windermere Real Estate/Mercer Island. Information and statistics derived from Northwest Multiple Listing Service and Trendgraphix, and deemed accurate but not guaranteed. Seattle cover photo courtesy of Codi Nelson and HD Estates. Eastside cover photo courtesy of Team RAREnorthwest and Elevato Photography. Condo cover photo courtesy of Jessica Livingston and im3rd Media. Waterfront cover photo courtesy of Anni Zilz and Clarity Northwest Photography.
